
Variability and process capability
Manufacturing and process capabilities are inseparable edges. Although it may not have been heard, simply say, process capability is ability to express the probability of fitting within the product’s standards in making the product .
Based on the capability index, we will grasp the loss of products and determine the inspection frequency. This way of thinking is used and applied also in considering probability other than monozukuri. Before explaining that, I would like to talk about product standards for making products.
Please look at “Noise of intention in decision” and “bias of intention in decision” for variations and bias in business and decision.
What are product standards?
There are standards for product manufacturing. For example, assume that a 100 cm stick is a product. There is no problem if the products are all 100 cm, 99 cm or 101 cm etc will come out on making.
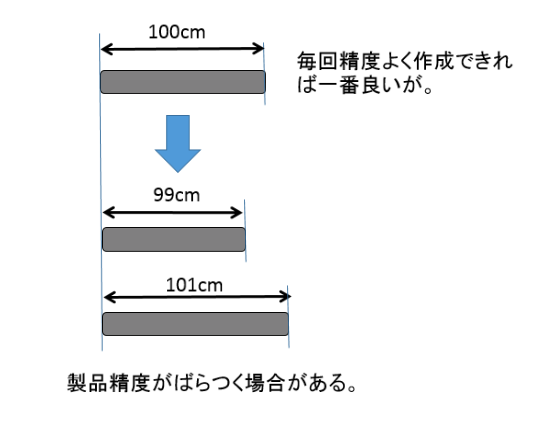
However, if the product can be released as a product, for example, 99 cm to 101 cm, the product can be put out to the world if it is 100 cm ± 1 cm. At this time “± 1 cm” is the standard. If it is 98 cm, it becomes a defective product and it becomes a manufacturing loss.
By stochastically obtaining variations (measured several products) for this standard, we can figure out the number of product losses and lead to quality assurance. We use a normal distribution to determine the number from the probability at this time.
The product standard is the acceptance range that allows products to be released to the world
Normal distribution and variation
What is a normal distribution?
The probability distribution that represents the distribution of data around the mean value is called a normal distribution.
Even other articles briefly explain, what is the normal distribution? I will briefly explain it for people.
Normal distribution is the distribution from average / center (variation). The distribution is used to explain probability theory and statistical theory that the degree of variation will converge to the form of a graph of normal distribution.
It is not a phenomenon of any kind but if there is no disturbance it will actually converge to the shape of that graph. For a relatively large number of process capabilities, we will decide that this variation will be distributed with probability along this normal distribution.
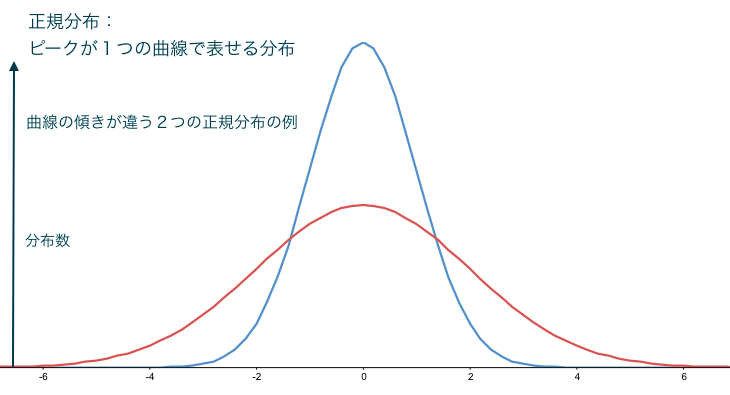
This figure is a graph of normal distribution, and the normal distribution can be represented by one curve with peaks. (The 0 on the X axis in the graph means the center.) In the figure, a normal distribution in which the slopes of the two curves are different is shown. Assuming that there is variation in shape along this normal distribution process capability to be described later will be issued.
I think I understood the distribution of how to vary. We will explain the standard deviation which is the standard value of variation method.
Shape of distribution in probability. The distribution of the nature world will converge to the shape of this graph if there is no disturbance.
What is the standard deviation?
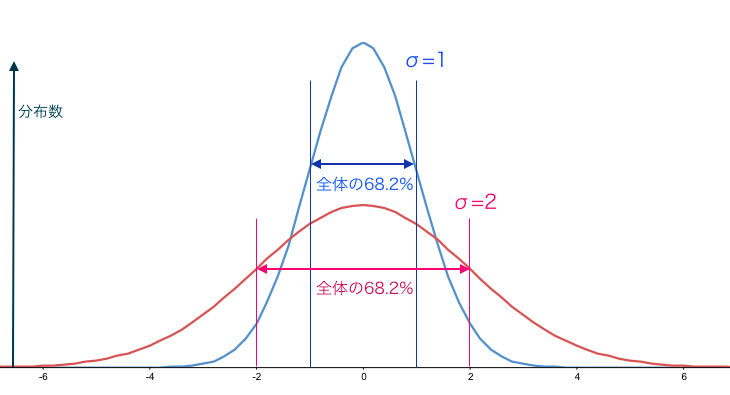
When values are distributed in the form of normal distribution, it is difficult to explain how much variation (how to tilt in the graph) exists. The criterion becomes the standard deviation. The standard deviation is scaled by σ, but this value also changes as the gradient of the graph changes, and the distribution between ± σ is 68.2% from the entire graph and distribution ratio Is fixed . Therefore, it is often used as reference value for variation .
Even if there are n variations (99 cm, 101 cm in the previous example), you can not grasp the position of the graph by simply adding, subtracting, or just breaking out the average. How do you ask for it?
Therefore, in order to judge to what extent it is away from the center value, subtract the value which deviates from the center value μ.
(μ – 99), (μ – 100), … n pieces
Even if it is added as it is, we only calculate the center value, we weight the way of spreading (spreading). Apply the same value (squared)
(μ – 99) ^ 2, (μ – 100) ^ 2, … n pieces
Add all the values and divide by (n – 1). This is the average value of the weighting of spreading.
((- 99) ^ 2 + (μ – 100) 2 + … n pieces) / (n – 1)
We call this dispersion as σ ^ 2. But it does not match the graph unit so it will not be displayed on the graph. Square root to make it the unit of the x axis of the graph.
σ=√(σ^2)
This is called standard deviation. This is a value that will be a measure of the dispersion.
Next, we will use this value to see how many can fit within the standard or not.
The standard deviation is a position that is an index of the inclination of the graph
The way of thinking is statistical analysis. Please see this reference if you want to know more.
Process Capability Indices
Process capability index CP value, CPK value
Process capability index CP value
I think that I do not know how much it is sensuously with the value of variation (standard deviation). Considering this as the probability or the number falling within the standard, it is necessary to compare with a reference value. The value to be compared is “CP value” .
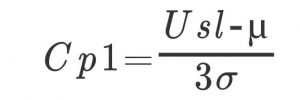
Usl: Standard upper limit value
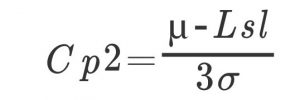
Lsl: Standard lower limit value
σ: standard deviation
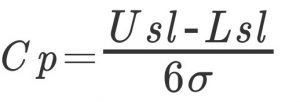
Although the calculation is expressed like this, the meaning is “Cp = 1 and the center value μ ± 3σ is the same as the standard width”. The width of the same standard as ± 3σ has the probability of 27 defects out of 10000 (nonstandard) occur.
What is one-sided standard?
It is an index that considers only the upper limit side or the lower limit side from the center from the difference between the two side standards. Therefore, calculation is done with half of 3σ.
Usl: Standard upper limit value
Lsl: Standard lower limit value
μ: average value
σ: standard deviation
Upper limit one side standard
Lower limit single side standard
The idea of the CP value is a value when the average is the same as the center of the standard, or when the center is not considered. Failure also occurs when the central value does not meet the standards. So we will talk about the center later “CPK value” will be the probability and number of taking into account the misalignment of the center. (The difference from the CP value is the difference in the center position)
“CP value” is a numerical value to be compared with a value serving as a guide
Process capability index CPK value
The way of thinking is the same, it is value taking into account the central deviation . Therefore, the one with the smaller value of one side standard becomes the CPK value.

For each company or product, measure the quality of the product, determine the content of the quality inspection, and judge the loss of the product depending on whether the CP value or the CPK value is larger than the set value.
Consider also the deviation of the “CPK value”
As a way of thinking, it is summarized below.
· CP value and CPK value are small → the defect rate is large. It tends to be defective in manufacturing (out of specification).
· CP value, CPK value & gt; Setting value: There are large variations, there is no standard center and average value. The set value is too severe.
· CP value & gt; setting value, CPK value & lt; setting value: Variation is large, setting value is too severe.
· CP value & lt; Setting value, CPK value & gt; Setting value: Standard center and average value are not present. The set value is too severe.
You can judge to what extent the defective rate is by setting value. Next, I would like to explain the setting values that will set the CP value and CPK value.
The CP value is a value to know to what extent it is within the specification range. The CPK value is a value which shows to what extent with respect to the standard range and the standardized center
Six Sigma and PPM
Before talking about setting values that will set CP value and CPK value, we will briefly explain words related to Six Sigma (6σ) and PPM defects.
In the manufacturing industry, Six Sigma (6σ) or PPM is often used.
What is PPM?
parts · par · million (one part per million) is called and is often used at the defect rate. For example, in 3PPM defective rate, the failure rate is 3/1000000. In the manufacturing industry, we often use this to express defective rates etc well.
Parts · Par · Million (one part per million).
It is often used with a value less than a percentage
What is Six Sigma (6σ)?
In the manufacturing industry, we decided to slogan Six Sigma to lower the defective rate and create a good product. In its slogan “We accept up to 3.4 (3.4 PPM) defects out of 1 million.” Actually, 6σ is statistically “2 out of 1 billion”, which is a much lower probability than the slogan mentioned earlier. As the idea of Six Sigma, 6 σ is taken into account, 1.5 σ is taken into consideration of blur such as deviation of the standard center from the average value to 4.5 σ “tolerance of defects of 3.4 (3.4 PPM) out of 1 million.
4.5 σ is a numerical value considering 1.5 σ for blur such as deviation of the standard center from the average value
CP value, set value of CPK value
The criterion of the CP value was ± 3 σ. (Center value μ ± 3σ is the same as the standard width and Cp = 1)
Compared with the concept of this PPM I tried to make it a table. However, it is the ideal defective rate of CP value (one side standard). In case of CP value (two-sided standard), the defect rate is doubled.
| Specification width | CP value (One side standard) |
Rejection rate (Nonstandard rate) |
Fraction defective[PPM] |
| 3σ | 1 | 1.4/1000 | 1350 |
| 4σ | 1.33 | 3.2/100000 | 32 |
| 4.5σ | 1.5 | 3.4/1000000 | 3.4 |
| 5σ | 1.67 | 2.8/10000000 | 0.28 |
| 6σ | 2 | 2/1000000000 | 0.002 |
As we said in the case of Six Sigma, 4.5 σ is the value of 3.4 PPM. For that reason, the setting values in the manufacturing industry are relatively using a CP value of 1.33 (32 PPM) of 4 σ and a CP value of 1.67 (0.28 PPM) of 5 σ.
The criterion of the defect rate can be determined from the set values of CP value and CPK value
& Nbsp;
How to use Excel
Some people think that “Calculation is difficult, so it can not be used”? However, if you use functions in Excel you can easily obtain it. I will explain how to do it.
As an example, suppose you make a product of “100 cm stick” and measure 10 pieces. Ten measurements were written on lines 2 to 11 of the C column. We will calculate the process capability CP value and CPK value at this time. D line is the calculation content of line C.
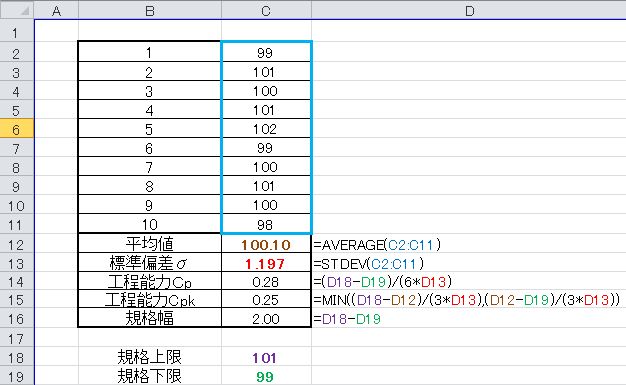
First, calculate the average value. We use Excel’s [AVERAGE function] for the mean value μ. (C Line 12 Line) I think that everyone understands this usage, but the range will be 10 measured values.
Find the standard deviation. The standard deviation σ is Excel’s [STDEV function]. It is a function that calculates the contents explained earlier in “Normal distribution and variation”. (C column, line 13) As well as AVERAGE, the range is 10 measured values.
We will calculate the CP value of process capability. It is the value obtained by dividing the standard width “standard upper limit – standard lower limit” by 6 σ as explained earlier in “Process capability index CP value”. (Line C, line 14)
We will calculate the CPK value of process capability. As explained earlier in the “Process capability index CPK value”, the smaller one obtained by dividing “standard upper limit – average” by 3 σ and the smaller “average – standard lower limit” divided by 3 σ as the one side standard becomes CPK value I will. (Line C, line 15)
If we summarize the order easily, we will ask in the following order.
- Mean value “μ”
- Standard deviation “σ”
- Process capability “CP value”
- Process capability “CPK value”
Process capability in the management field
Likewise, it can be used depending on ingenuity in management.
For example,
·production quantity
· Standard work in process
· Workload of subordinates (overtime)
Such
However, it can be managed only by thinking that the variation will be a normal distribution.
In other words, if it seems to be a normal distribution, you can use it accurately.
Statistical method that can use process capability in various fields
Relationship with educational scholastic ability deviation value
You often hear the deviation value, do not you? Although the deviation value itself is difficult to understand, it can easily be inferred from “how much group” from the idea of normal distribution.
The deviation value is the same as the previous way of thinking, and it is a value representing the position in the whole.
As we said earlier, we can guess if it is a normal distribution (one distribution peak).
Scholastic deviation values are calculated as follows.
Deviation value = ((score – average point) / standard deviation) × 10 + 50
We calculate the standard deviation as 10 and the average value as 50.
Easily made a list of deviation values.
However, these may be only Japan.
| Deviation value | ranking |
| 90 | 0.000032*Total number |
| 80 | 0.001350*Total number |
| 70 | 0.022750*Total number |
| 60 | 0.158660*Total number |
| 55 | 0.308538*Total number |
| 50 | 0.500000*Total number |
| 45 | 0.691462*Total number |
| 40 | 0.841134*Total number |
| 30 | 0.977250*Total number |
| 20 | 0.99865*Total number |
| 10 | 0.999968*Total number |
The following books will be helpful.
Please refer to those who want to know more.
Layout correction 2017/03/22

PPMは「ピース・パー・ミリオン」ではなく「パーツ・パー・ミリオン」ですよ。
品質工学じゃなくても、大学教養レベルの常識かと。
ご指摘ありがとうございます。
確かにPPMは「ピース・パー・ミリオン」ではなく「パーツ・パー・ミリオン」でした。
どこかで間違えていました。
ここで覚えていった人がいたら申し訳ありません。
修正して覚えてください。