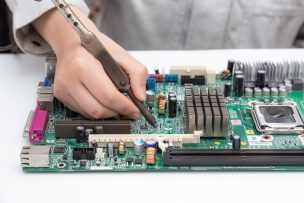
画像制御 カメラ選定〜制御
From now on, products and facilities by image recognition and image control will increase more and more.
Accuracy and design method will also change accordingly. Here I would like to explain how to use in an easy-to-understand manner.
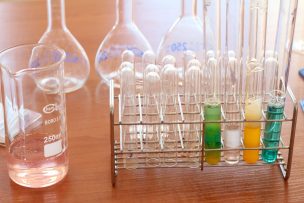
Inspection by imaging equipment, measurement example:
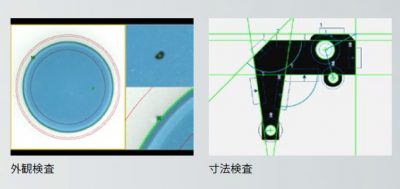
©Keyence/CV-Xseries
I was thinking of writing in the order of development, but I especially wanted to write it earlier, as there was a request for this topic.
Flow of image control and design
In order to incorporate and use the imaging device, it is necessary to easily consider the following as a design.
· Where do you want to see?
· Work distance
· Required precision
· How to maintain
· What to do (measurement, recognition)
Compare with model image (pre-registered image)
→ OK / NG or presence / absence judgment
→ Measure model image position
Specify measurement range from image and measure
→ Detect edge and measure position
→ Detect circle and measure position
· Where do you want to see?
Only the shape of the edge of the work
→ Transmission lighting · Backlight lighting
→ gray or black and white camera
(Grayscale, binarization process)
(Projection of shape: It will be like a shadow picture)
I want to suppress disturbance light and diffused reflection against a work
→ dome lighting · ring lighting
(Lighting surrounding the camera)
I want to increase the amount of light to work, I want to add lighting
→ Bar lighting
→ Spot lighting
(When you want to increase partial illumination, shutter speed, etc.)
I want to see fine scratches, shallow grooves
→ blue lighting color, camera color filter
I want to ignore a specific color
→ Color filter of camera
→ color camera
I want to judge by color
→ color camera
(Judged from hue, saturation, brightness)
Color filter (I want to ignore a specific color)
Grayscale (contrast only)
– Work distance
→ Work distance
(Distance between work and lens, field of view range)
→ depth of field
(Variation in distance to workpiece)
Required accuracy
→ Direct Accuracy
(Lens magnification, area to be received (imaging area), number of pixels)
→ accuracy and range that you need to think
(Distortion of lens (distortion), allowable focus blur amount (permissible circle of confusion))
How to maintain
→ White balance
(Gray card (reflectance 18%))
→ Work reference position
→ Calibration of camera coordinate system and work coordinate system
Let’s put these in one corner of the head and take it into consideration in the selection.
Prior to selection (pixel, idea of camera)
pixel
A pixel or pixel is the smallest unit that can display image information.
It means that you can represent an image with 2 million pixels (2 megapixels) ≈ 2 million points (image information). Simply put, it is resolution.
The size of the light receiving element of the camera itself is relevant. The range of the field of view is determined by the area to be received (imaging area) and the magnification that can be captured by the lens.
Since the field of view can be displayed by the number of pixels, the precision that can be represented by one pixel can be obtained.
Therefore, accuracy and viewing range change with combination of “number of pixels”, “area to receive (imaging area)” and “magnification of the lens”.
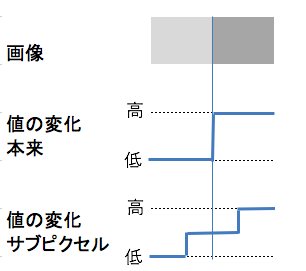
subpixel processing
It is a method to virtually calculate between a pixel and a pixel. It is judged as a numerical value intermediate between the value acquired by the pixel and the value acquired by another pixel and displayed.
Although it is not actually captured values, the ambiguity of the image (extremely small change is unlikely to occur in a very small range)
It is a method that complements the value as. Suppress errors when measuring edges from images.
However, I think that it is better not to set the tolerance of the resolution to be the minimum.
(Resolution of camera = number of pixels, number of pixels * 2 not to be taken)
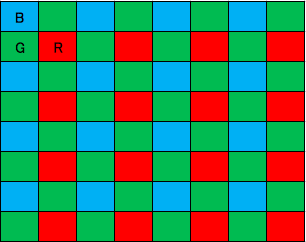
Bayer array
In the case of a color camera, elements arranged through filters of red, green and blue (RGB) are arranged side by side.
Although it recognizes color, actual pixel size does not become the tolerance of camera resolution.
(It will be doubled.)
Therefore, when importing with grayscale, it may be better to capture with a black and white camera.
Some manufacturers complement their resolution by subpixel processing.
Depending on the camera, if you want to know more, please contact each manufacturer.
Accuracy and field of view change with combination of “number of pixels” “area to receive (imaging area)” “magnification of lens”
How to select camera / lens
Field of View and Accuracy
In considering accuracy, you need to pay attention to the following points.
Direct Accuracy: “Lens magnification” “Area to receive (imaging area)” “Number of pixels”
Accuracy that needs to be considered, range: “Distortion of lens (distortion)” “Amount of blurred focus (permissible circle of confusion)”
“magnification of the lens” “area to receive (imaging area)” = field of view
The range of the field of view is determined by the combination of the camera and the lens. Where the camera and lens sell together, I think that the distance (working distance) from the lens to the workpiece and the graph of the field of vision are provided as follows.
The following is a view of the table as an example.
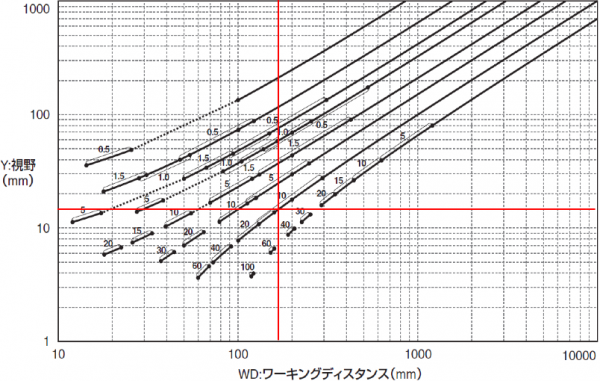
Select the camera and lens at the point of intersection from the distance from the lens to the work (working distance) and the field of view.
In this graph, the working distance is 110 mm and the field of view (long axis) is 11 mm.
“Number of pixels” “Viewing range” = Direct precision
Consider the case of 2 million pixels (in the case of 1600 x 1200, exactly 1.92 million pixels) and the field of view 11 mm x 8.25 mm.
11 [mm] / 1600 [pixel] = 0.00688 [mm / pixel] = 6.88 [μm / pixel]
. However, this can not be used as it is as precision.
lens distortion (distortion)
Distortion always exists in the lens Especially distortion is likely to occur at the edge of the lens. Therefore, when you use it, the range becomes narrower, or you need to think based on examination. Some applications convert to a coordinate system without distortion.
As the end of the lens is distorted, it can not be used accurately like other parts of the lens.
Below is the image of distortion aberration.
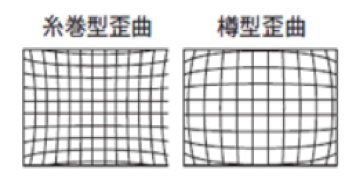
Here, the range without distortion is within the range of the red frame in the figure below.
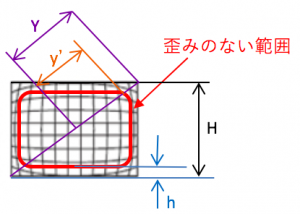
There are optical distortion ratio or TV distortion ratio in lens specification. The relational expression in this case is as follows.
Optical distortion
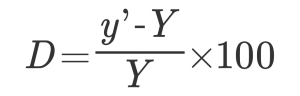
TV distortion

As an example, we will explain it as optical distortion 0.1% in the case of the field of view (11 mm x 8.25 mm).
The calculation is omitted, but Y = 6.875 mm, y ‘= 6.868 mm.
Therefore, it is necessary to limit the actual field of view (usage range) to 10.99 mm x 8.24 mm, or to make correction calculation that takes distortion into account.
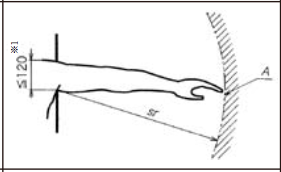
– Allowable out-of-focus blur amount (permissible circle of confusion)
The amount of blurred focus that is allowed when it is regarded that the subject is in focus
If it is not specified, I think that it is one pixel worth.
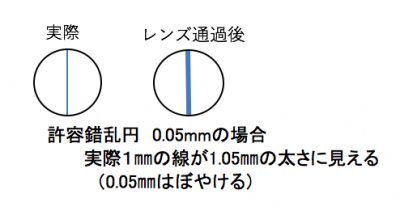
Here, as an example from the previous example, considering 5.5 [μm] x 5.5 [μm] per pixel, the accuracy becomes worse accordingly.
· To what extent does accuracy need to be considered after all?
“Direct Accuracy” + “Accuracy, range that needs to be considered” is the accuracy and range when images are acquired with the camera.
Considering the 2 million pixel camera so far, and the field of view range 11 mm × 8.25 mm, “direct accuracy” is 6.88 [μm / pixel].
“Accuracy necessary to think” is 5.5 [μm] of permissible circle of confusion
Total accuracy = 6.88 [μm] +5.5 [μm] = 12.38 [μm]
You can detect more than 24.76 [μm] from the idea of sampling (more than twice) from this camera and lens.
However, it is assumed that the subject is in focus.
The usable range is 10.99 mm x 8.24 mm.
· Mounter shape of lens and camera
At the end of the selection of the camera and lens, there are many types of mounters with lenses and cameras attached.
There are various kinds such as C mount, CS mount, M12 mount, etc. It will differ in diameter, screw pitch and so on.
I think that there is no particular problem when purchasing a camera and a lens that are compatible with the same manufacturer.
Selection of the camera is done by finding the precision desired to see from the lens and the camera
Selection of lighting
Lighting selection becomes very important.
It depends on the shutter speed, the depth of field, and how to recognize the image.
If you actually try using the image and trying it out, a case may arise that is different from your mind.
Difference in light application by material
Work image on metal (engraved on metal)
Since light reflection is strong, regular reflection (direct reflected light) is used
→ Apply light from the front
Work image under film (work under reflective object)
Halation (reflection of lighting) is strong, so diffuse reflection (not directly reflected light)
→ Apply light at an angle
· Work image under the thin paper etc.
Since the reflectivity of the paper itself is bad, it is difficult to see the underlying paper
→ Apply light from the bottom of the paper (Transparent illumination)
Functional lighting differences
· Only the shape of the edge of the work
→ Transmission lighting · Backlight lighting
· I want to suppress the disturbance light and the diffused reflection against the work
→ dome lighting · ring lighting
(Lighting surrounding the camera)
· I want to increase the amount of light to the work, I want to add lights
→ Bar lighting
→ Spot lighting
(When you want to increase partial illumination, shutter speed, etc.)
· I want to see fine scratches, shallow grooves
→ blue lighting color, camera color filter
· I want to ignore specific colors
→ Color filter of camera
Lighting also affects camera image recognition depending on position, strength, color
Pint setting / way of thinking
If focusing is best, it is best that the distance between the lens and the workpiece varies depending on the workpiece.
It is also possible to expand the range of focus.
It is possible to adjust the amount of light.
F value
People who have used cameras at the border are the part of the aperture. I think that you can understand Brightness is adjusted by this aperture.
An indicator showing the brightness of the lens. The smaller the F value is, the brighter it is.
The brightness through the lens is 1 / (F value * F value)
depth of field
Even if the workpiece surface moves back and forth with respect to the lens, it will be in a range where the focus can be clearly received without blurring.
Let’s examine how much the work varies with the lens first.
I will explain the calculation as an accurate range.
First of all, optical magnification is necessary.
Please stop it from the lens or the following formula.
Optical magnification M = one side of the receiving surface (one side of the imaging surface) / one side of the field of view range
Example: (H of imaging surface) 8.8 mm / (field of view H) 11 mm = 0.8
Next, execution F is necessary, and the calculation formula is obtained from F value.
Execution F is a value representing brightness in distance.
![]()
Execution F = (1 + optical magnification) * F value
FNO: F value, M: optical magnification
Example: (1 + 0.8) * (F value) 2 = 3.6
We will calculate the depth of field.
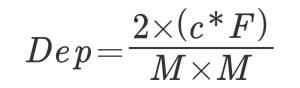
Depth of field = 2 * (permissible circle of confusion * execution F) / (optical magnification * optical magnification)
C: permissible circle of confusion, F: execution F, M: optical magnification
Example: 2 * (0.01 * 3.6) / (0.8 * 0.8) = 0.11 [mm] width
The larger the F value, the darker the depth of field becomes wider. I will briefly explain the features.
Characteristic:
The larger the F value is, the larger the depth of field becomes. (The more the focus value is blurred, the more it is focused)
When the focal length is short, the depth of field decreases
The depth of field decreases if the work is nearby
Selection of the camera is done by finding the precision desired to see from the lens and the camera
The image detection method (mechanism of edge detection method) etc. uses the method of each control device, so we will skip this time.
From here, I will tell you how to devise how to relate an image to an actual work (how to control from an image).
Therefore, please refer to this book if you would like to know more about the mechanism of image processing method.
図解入門よくわかる最新画像処理アルゴリズムの基本と仕組み (How‐nual Visual Guide Book)
Image control method
On the control of the image, it is better to consider the content described below as a minimum.
· Setting method of detection range
· Devices for model search
· Devices for edge detection
Difference in coordinate system
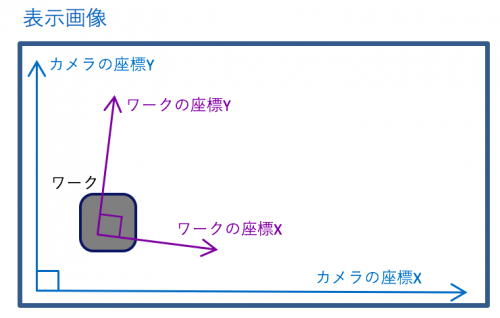
I am taking pictures with the camera, but what I want is the original coordinate system of the workpiece.
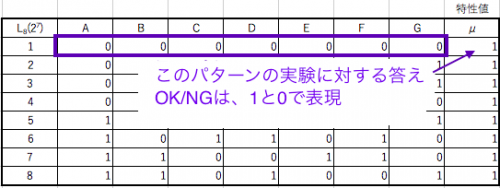
It is not necessary to judge OK / NG etc, but it is necessary when using position or measurement.
The image is as follows.
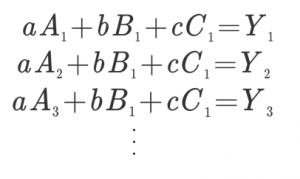
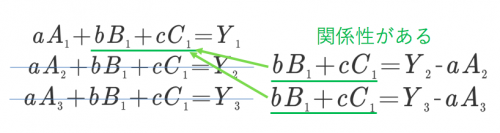
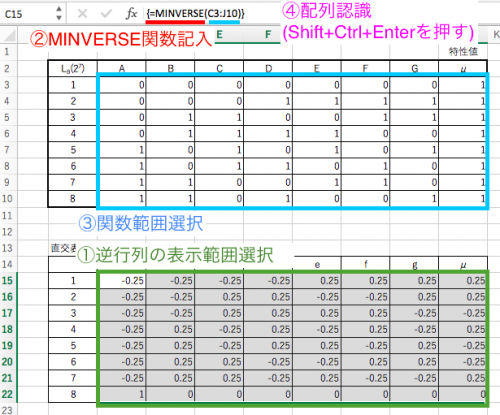
In the case of a moving work, move at least two points on the screen and if there are mechanical standards, calibrate it by also taking two or more points on the screen so that you can know the position on the screen based on it. If there is no calibration of the coordinate system, tilt from the 2 point position, multiply the intercept of the work coordinate by sending an intercept can convert from the camera coordinate system to the work coordinate system. Please do this calculation and figure out the position.
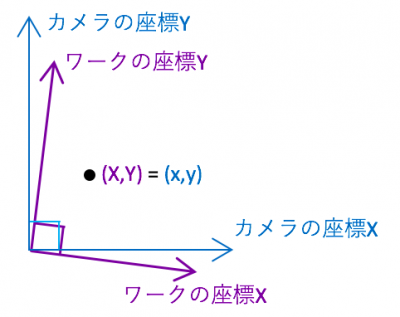
This time I will show the conversion from the angle difference of the axis easily. As a method there is not limited to this, please consider it because there are various ways.
Let’s say that the axis (x, y) of the coordinate system of the camera and the axis (X, Y) of the coordinate system of the workpiece are tilted (angled) as shown below. At that time, compare the value when only one axis of the coordinate system of the work is changed with the coordinate system of the camera.
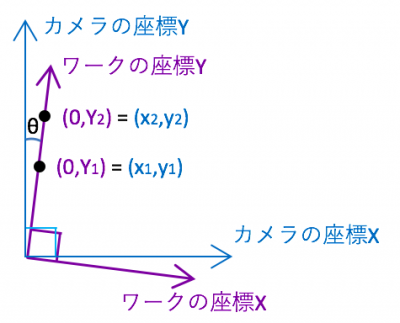
At this time angle θ can be expressed as follows.
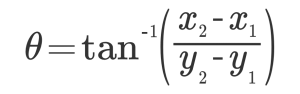
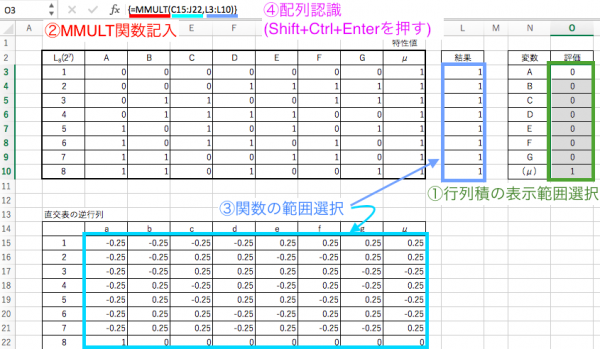
The converted ratio of the coordinate system of the workpiece from the coordinate system of the camera is as follows.
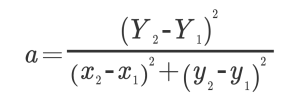
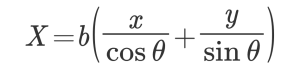
Once we find the conversion constant like this. (The X side will do the same.)
From there, expand the transformation formula to arbitrary coordinates as below and consider it as work coordinates.
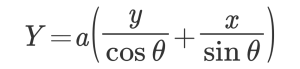
A: Conversion ratio of work coordinate Y axis
B: Conversion ratio of work coordinate X axis
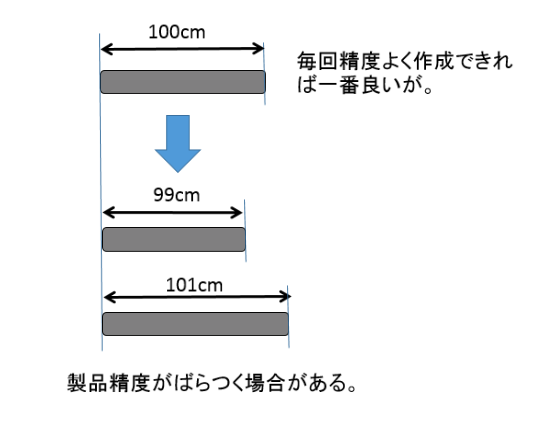
How to set detection range
The range will be minimized if the actual work is repeated at the same position each time.
Therefore, let’s design to come to the same position as much as possible. However, I will not go that far.
Even if you try to come to the same position, let’s consider the following.
· Machine stacking tolerance, machining tolerance, assembly tolerance (generated by reassembling, negligible by calibration)
· Processing tolerance of work (variation of work)
· Other design considerations
Let’s set the detection range beyond the maximum design tolerance which adds all these.
ingenuity at model search
It is a method of finding the actual work position / work presence / absence from the reference model image (reference work figure).
It depends on the manufacturer, but I am looking for with the appearance of edge and color recognition.
Therefore, you may not be able to detect without paying attention to the following.
· Do not make models too small
· Do not give model recognition sensitivity (correlation value level: consistency) too high
· Shape and color similar to model do not exist in detection range
The model search compares and identifies the position and orientation of the work in any state.
However, it takes time to detect if the detection range is too wide or if the direction corresponds to 360 °.
It is better to regulate the detection range as much as possible and regulate the detection orientation (direction of comparison of model images).
ingenuity at edge detection
Here, we will explain in particular the points to note when using images as measurements.
For the majority of model comparisons and measurements, we will extract the change part of color (gradation derivative) as an edge.
In the model comparison, since it is judged to what extent it is close to the model image, it is not necessary to stick to detection much, but in case of measuring from the edge (measured at the change portion of the shading), caution is necessary.
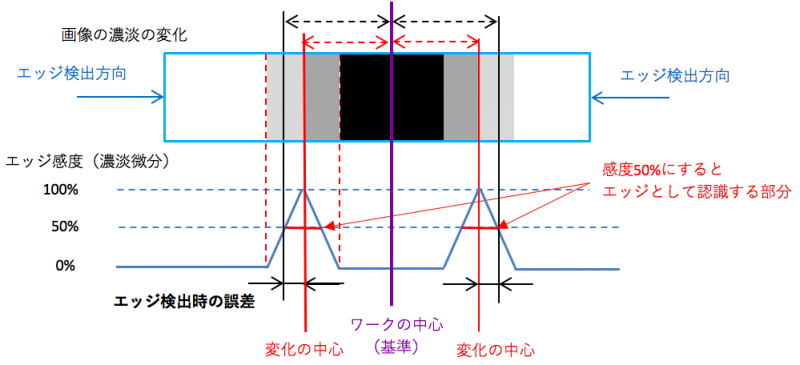
The center of gradation change (the original edge) and the place the image recognizes as an edge are somewhat different.
In addition, edge sensitivity needs to be changed depending on the material. (Because metals have high reflectance and papers have low reflectance)
Below is the image image.
We set the sensitivity to recognize as an edge (here 50 is slightly different in position)
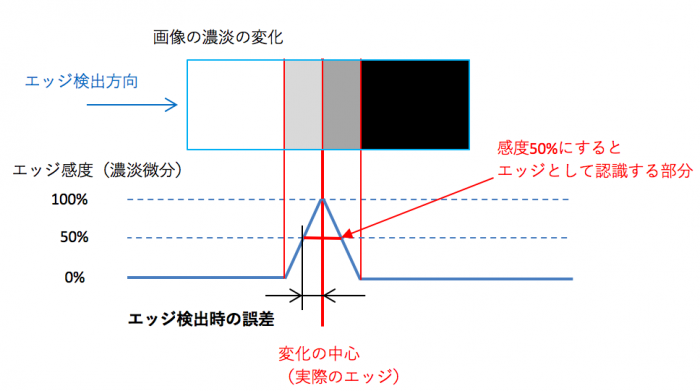
In this way, the center and difference of the actual change come out. If we take the “center of the range captured as an edge” (the center of the place where the edge sensitivity is 50% or more here), will it match “the center of change”? I think that some degree of error comes out because the degree of change (sensitivity) of the image does not change uniformly depending on the color. Therefore, calibrate the position of the image and the real thing, or devise the measurement method.
As a measure of the measuring method, not extracting the position from one edge but extracting the other edge, and using the center of that edge and edge as the measurement point.
Although the figure above was “White → Black”, I will try to detect the edge from the reverse direction in another place (another edge) where it changes to “Black → White” as it is.
By doing so, it prevents a difference from occurring due to focus blurring etc.
I will explain with a simple figure.
The edge is detected with the same edge sensitivity from the opposite direction. The center of the position of the edge in the forward direction and the center of the position of the edge in the opposite direction is the center of the actual work. By doing so, the criteria detected from the work center and the edge are the same.
These “image control methods” are just a part of the control. It can be applied to many things and can be utilized. Please try it.
It can be applied to considerable precision and various things depending on the ingenuity.
trend of recent image processing device
The image processing device was mostly that maintenance and adjustment were very difficult.
Recently, simple image processing devices (sensors) similar to tuning-less, fiber sensor, photoelectric sensor are coming out.
I think that it will gradually increase from now on.
It seems that it will become mainstream not only as FA (factory automation) but also as a technology addition product.
Image processing technology gradually becomes widely used in various fields
Was it helpful? There are various other methods, and each maker is changing to a method that can be done more easily.
However, there are things such as precision and speed unless you consider it, so let’s design firmly there.
The image detection method (the mechanism of edge detection method) etc. uses the method of each control device, so we omitted this time.
If you want to know more about the mechanism of image processing method, this is easy to understand.


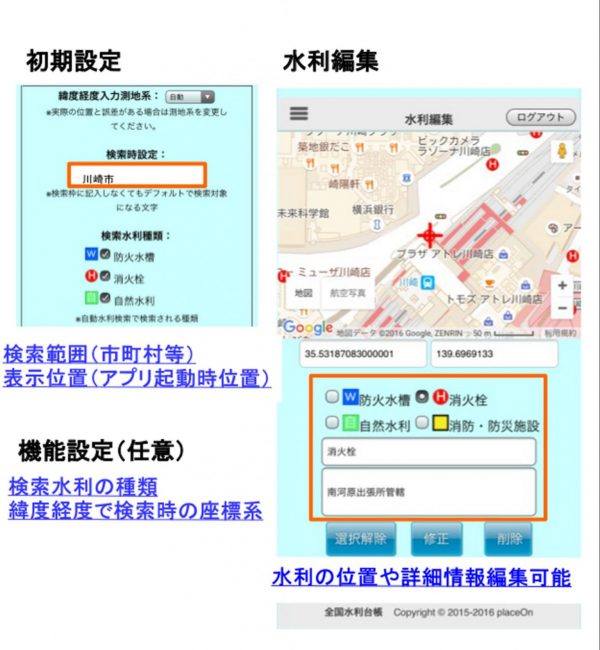
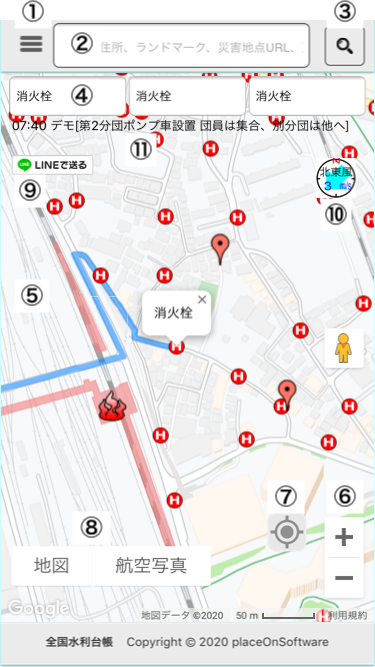
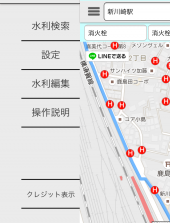
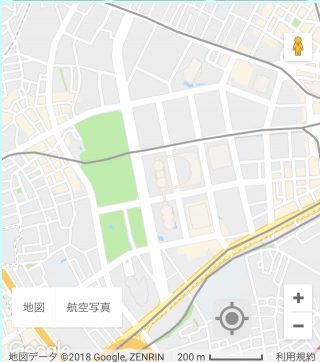
 全国水利台帳Lite